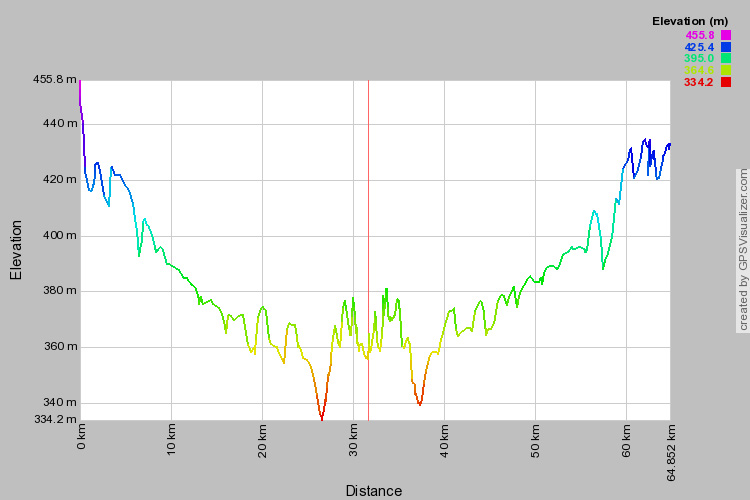
I thought it might be interesting to use my GPS to track the elevation changes on my drive to work and back each day. Since my route to work roughly follows the Grand River, I knew that it was generally downhill from Elora to Waterloo, but it is neat to see it quantified like this.
I'm not entirely sure why the graph is not symmetric, but it could be due to some GPS glitches at the start of the trip, coupled with taking slightly different routes to work and back. The lowest point in the graph is definitely when I cross the Bridge Street bridge in Kitchener.
Technical Details: This graph was generated using data from my Garmin Nuvi GPS.
Hosted by theorem.ca